
🔥Solving AWS Bedrock's Enterprise Logging Problem: Adding Bot Context to Model Invocation Logs🔥
aka, who is using up all our AI tokens?

This blog series focuses on presenting complex DevOps projects as simple and approachable via plain language and lots of pictures. You can do it!
These articles are supported by readers, please consider subscribing to support me writing more of these articles <3 :)
Hey all! Today we’re tackling a problem that’s been driving me crazy since we started scaling our AWS Bedrock bot deployments across the enterprise. You’d think that when you have multiple AI bots running in production, AWS would give you some reasonable way to separate and monitor their activities. You’d be wrong.
Here’s the issue: every single AWS Bedrock model invocation in a region gets dumped into one massive CloudWatch log group. Doesn’t matter if you have five different bots serving different teams, or if Bot A is handling customer support while Bot B is doing internal documentation queries. Everything goes into `/aws/bedrock/modelinvocations` and good luck figuring out which log entry came from which bot.
This creates a monitoring nightmare. When someone asks “how much is our Slack bot costing us?” or “why did the support bot give a weird response yesterday?” you’re stuck grep-ing through thousands of log entries that all look identical. The raw Bedrock logs contain the model inputs and outputs, but zero context about which application made the call or who the actual user was.
After dealing with this mess for way too long, I finally built a solution that transforms these useless raw logs into something actually meaningful for enterprise monitoring. We’re talking about a Kinesis Firehose pipeline with a custom Lambda processor that parses the Bedrock JSON and adds the context that should have been there in the first place.
The enhancement adds four key fields that make all the difference: `botName` (extracted from the IAM role), `botOutput` (what the bot actually said to the user), `user` (who asked the question), and `query` (what they asked). Suddenly, instead of cryptic JSON blobs, you have logs that tell a story about real conversations happening in your enterprise.
This approach works for any AWS Bedrock deployment, but it’s especially valuable if you’re running multiple bots or need to track usage by team, project, or individual users. The processed logs flow into whatever monitoring system you’re already using - in our case, Splunk - where they become the foundation for dashboards, alerting, and cost attribution.
Let’s walk through how this whole system works and why it’s become essential for managing AI deployments at enterprise scale.
If you don’t care about the write-up and just want the code, you can find the modified cloudwatch to splunk lambda that adds bot information here:
The Problem: AWS Bedrock’s Logging Black Hole
To understand why this solution matters, you need to see just how broken the default AWS Bedrock logging situation really is. When you make a model invocation through Bedrock, AWS dutifully logs the entire interaction to CloudWatch - which sounds great until you realize where those logs actually end up.
Every single model invocation in a region gets dumped into `/aws/bedrock/modelinvocations`. Your customer support bot? Same log group. Your internal documentation bot? Same log group. That experimental bot someone in marketing is testing? Yep, same log group. It’s like throwing all your mail into one giant pile and then wondering why you can’t find anything.
AWS does include some metadata with each log entry - most importantly, the IAM role ARN that made the request. So technically, you can tell which bot generated which log entry. But here’s the catch: you have to parse through thousands of nearly identical JSON blobs to find the entries you care about, and even then, the raw logs don’t tell you anything useful about the actual conversation.
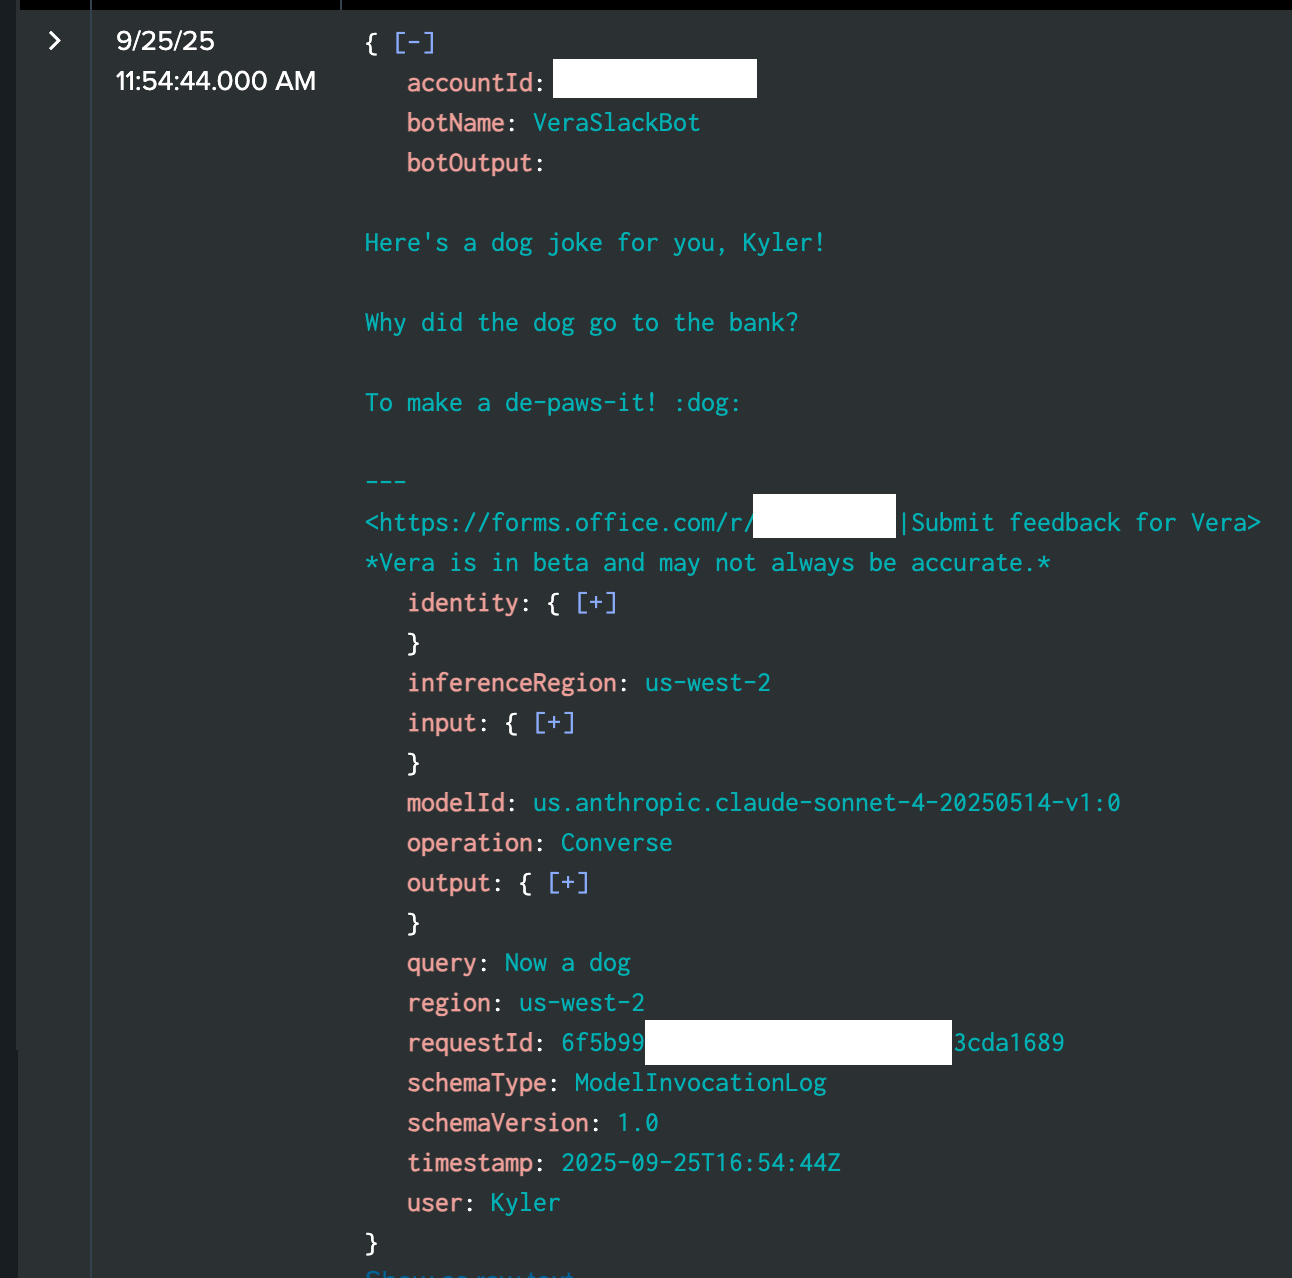
Here’s what a typical raw Bedrock log entry looks like - it’s hundreds of lines of nested JSON containing the full model request and response, but buried so deep in structure that extracting meaningful information requires serious JSON archaeology. You can see the complete input and output, but good luck figuring out which user asked what question or what the bot actually said back to them.
The enterprise implications are brutal. When your CFO asks “how much are we spending on the Slack bot versus the customer support bot?” you can’t answer without building custom tooling to parse through the log mess. When a user reports “the bot gave me a weird answer yesterday,” you’re looking at potentially thousands of log entries with no easy way to find their specific interaction.
Even basic monitoring becomes a nightmare. Want to set up alerts for when a specific bot starts giving errors? You’ll need to craft complex CloudWatch filters that parse the IAM role ARN and hope you can distinguish between different types of failures. Want to track usage patterns or popular queries? Hope you enjoy writing custom log analysis scripts.
The root issue is that AWS designed Bedrock logging for debugging individual model calls, not for managing multiple production AI applications. They give you all the technical details about the model invocation but none of the business context about who asked what and why. For a single-bot deployment, this might be manageable. For enterprise deployments with multiple bots serving different teams and use cases, it’s completely unworkable.
The Solution: Enhanced Log Processing Pipeline
The answer to this mess is surprisingly straightforward: transform them on their way to your monitoring system.
Here’s the architecture: CloudWatch subscription filter → Kinesis Firehose → Lambda processor → Splunk. The raw Bedrock logs stay exactly as AWS created them in CloudWatch. But when they flow to Splunk through our pipeline, they get enhanced with the context that actually matters.
The Lambda processor is where the magic happens. It takes those massive, cryptic JSON blobs and transforms them into something humans can actually understand. Instead of hundreds of lines of nested structures arriving in Splunk, you get clean log entries with the four fields that matter: `botName` (which bot generated this), `botOutput` (what it actually said), `user` (who asked the question), and `query` (what they asked).
The processor extracts the bot name from the IAM role ARN, navigates through the complex nested JSON to find the actual response text, and parses conversation formats to identify users and their questions. What used to require custom scripts and manual investigation now happens automatically for every single log entry flowing into your monitoring system.
The beauty of this approach is that it’s completely non-intrusive. Your CloudWatch logs remain untouched for AWS debugging purposes, but your enterprise monitoring gets the enriched context it needs. The whole pipeline uses standard AWS services, scales automatically, and integrates seamlessly with whatever log aggregation platform you’re already using.
Log Enhancement
The real work happens inside the Lambda processor, where we parse the Bedrock JSON and extract the four fields that actually matter for enterprise monitoring.
Bot Name Extraction
This one’s straightforward. Every Bedrock log includes the IAM role ARN that made the request. We just grab the last segment after the final slash - so `arn:aws:iam::123456789012:role/VeraSlackBot-Worker` becomes `VeraSlackBot-Worker`. Simple, but effective for distinguishing between different bots.
Bot Output Parsing
This is where things get messy. The actual response text is buried deep in the JSON structure at `output.outputBodyJson.output.message.content[0].text`. That’s five levels of nesting just to find out what the bot said to the user.
User and Query Extraction
The most complex part involves parsing the conversation format from the input messages. Our bots format user messages as “Kyler (she/her) says: Now a dog.” - so we need to split on “ says: “ and extract the username before any parentheses. The query is everything after the colon.
| def transformLogEvent(log_event, acct, arn, loggrp, logstrm, filterName): | |
| enhanced_event = {} | |
| try: | |
| enhanced_event = json.loads(log_event['message']) | |
| except json.JSONDecodeError: | |
| enhanced_event = {"raw_message": log_event['message']} | |
| # Extract botOutput from output.outputBodyJson.output.message.content[0].text | |
| try: | |
| if ('output' in enhanced_event and | |
| 'outputBodyJson' in enhanced_event['output'] and | |
| 'output' in enhanced_event['output']['outputBodyJson'] and | |
| 'message' in enhanced_event['output']['outputBodyJson']['output'] and | |
| 'content' in enhanced_event['output']['outputBodyJson']['output']['message']): | |
| content_array = enhanced_event['output']['outputBodyJson']['output']['message']['content'] | |
| if len(content_array) > 0 and 'text' in content_array[0]: | |
| enhanced_event['botOutput'] = content_array[0]['text'] | |
| except (KeyError, TypeError, IndexError): | |
| pass | |
| # Extract user and query from input.inputBodyJson.messages | |
| try: | |
| if ('input' in enhanced_event and | |
| 'inputBodyJson' in enhanced_event['input'] and | |
| 'messages' in enhanced_event['input']['inputBodyJson']): | |
| messages = enhanced_event['input']['inputBodyJson']['messages'] | |
| for message in reversed(messages): | |
| if (message.get('role') == 'user' and | |
| 'content' in message and | |
| len(message['content']) > 0 and | |
| 'text' in message['content'][0]): | |
| user_text = message['content'][0]['text'] | |
| if ' says: ' in user_text: | |
| user_part, query_part = user_text.split(' says: ', 1) | |
| enhanced_event['user'] = user_part.split(' (')[0] | |
| enhanced_event['query'] = query_part | |
| break | |
| except (KeyError, TypeError, IndexError, ValueError): | |
| pass | |
| return json.dumps(enhanced_event) |
The code handles all the edge cases gracefully. If any field can’t be extracted, we just skip it rather than failing the entire log processing. This keeps the pipeline resilient when AWS changes log formats or when we encounter unexpected message structures.
What emerges from this parsing is a clean, searchable log entry that tells the complete story: which bot responded to which user’s query with what output. Instead of archaeological JSON excavation, you get logs that humans can actually read and monitoring systems can actually use.
Terraform Infrastructure: Making It Work
Setting up this pipeline requires several Terraform resources working together. The core piece is the Kinesis Firehose delivery stream that connects everything.
CloudWatch Subscription Filter
First, you need a subscription filter on the Bedrock log group that forwards all log events to your Firehose stream. This is the entry point that captures every Bedrock model invocation as it gets logged.
IAM Roles and Permissions
The pipeline requires two main IAM roles. One for CloudWatch to write to Firehose, and another for Firehose to invoke your Lambda processor and write to S3 for failed events. Standard AWS service-to-service permissions, but they need to be configured correctly or nothing works.
Lambda Function
Your log processing Lambda function needs the right runtime (Python 3.13), appropriate timeout settings, and environment variables for any custom configuration like Splunk source types.
Kinesis Firehose Configuration
| resource "aws_kinesis_firehose_delivery_stream" "bedrock_logs" { | |
| name = "bedrock-logs-to-splunk" | |
| destination = "splunk" | |
| splunk_configuration { | |
| hec_endpoint = "https://http-inputs-example.splunkcloud.com/services/collector/event:443" | |
| hec_token = var.splunk_hec_token | |
| hec_endpoint_type = "Event" | |
| s3_backup_mode = "FailedEventsOnly" | |
| processing_configuration { | |
| enabled = true | |
| processors { | |
| type = "Lambda" | |
| parameters { | |
| parameter_name = "LambdaArn" | |
| parameter_value = aws_lambda_function.cw_log_processor.arn | |
| } | |
| } | |
| } | |
| s3_configuration { | |
| role_arn = aws_iam_role.firehose_delivery_role.arn | |
| bucket_arn = aws_s3_bucket.failed_logs.arn | |
| prefix = "failed-bedrock-logs/" | |
| error_output_prefix = "errors/" | |
| buffer_size = 5 | |
| buffer_interval = 300 | |
| } | |
| } | |
| server_side_encryption { | |
| enabled = true | |
| } | |
| } |
The Firehose configuration is where everything comes together. You specify your Splunk endpoint, configure the Lambda processor, and set up S3 backup for failed events. The processing configuration is key - that’s what tells Firehose to run your custom Lambda function on every log batch before sending to Splunk.
Error Handling
Don’t forget S3 backup for failed events. When something goes wrong with log processing or Splunk delivery, you want those logs going somewhere you can investigate later rather than disappearing into the void.
Real-World Impact and Benefits
The difference this makes in day-to-day operations is dramatic.
Individual Bot Monitoring
Suddenly, you can answer basic questions about your AI deployments. “How much is the customer support bot costing us?” becomes a simple Splunk query filtering by `botName`. “Which bot is getting the most usage?” is just a matter of counting log entries by bot. No more spreadsheet gymnastics or manual log parsing.
Troubleshooting User Interactions
When someone reports “the bot gave me a weird answer,” you can actually find their interaction. Search for their username and the approximate time, and there’s the complete conversation - what they asked, what the bot responded with, and all the underlying model invocation details. This turns impossible debugging sessions into five-minute investigations.
Cost Attribution and Chargeback
Enterprise teams love being able to track costs by department or project. With botName extraction, you can build dashboards that show exactly how much each team is spending on AI. Finance gets happy, teams get visibility into their usage, and everyone makes better decisions about resource allocation.
Performance Insights
The enriched logs reveal usage patterns you never knew existed. Which types of queries take the longest to process? What time of day sees the most bot activity? Are certain users asking the same questions repeatedly (hint: maybe your documentation needs work)?
Integration with Existing Monitoring
Because the enhanced logs flow into whatever monitoring system you’re already using, all your existing dashboards, alerts, and processes just work. Set up alerts when a specific bot starts throwing errors. Create dashboards showing conversation trends across different teams. Build reports on AI adoption across the organization.
Conversation Analytics
Having the actual user queries and bot responses in searchable logs opens up possibilities for conversation analytics. You can identify common question patterns, track how bot responses change over time, and even spot opportunities for better training data or system improvements.
The end result is that AWS Bedrock goes from being a black box that costs money to being a transparent, manageable enterprise service that you can actually operate with confidence.
Summary
AWS Bedrock dumps all model invocation logs into a single regional CloudWatch log group, making enterprise monitoring nearly impossible. This creates chaos when trying to track costs, troubleshoot issues, or monitor multiple bots.
The solution: a Kinesis Firehose pipeline with a custom Lambda processor that intercepts logs flowing to Splunk and adds essential context. The processor extracts botName (from IAM role), botOutput (actual response), user (who asked), and query (what they asked) from the raw JSON.
This transforms cryptic Bedrock logs into actionable monitoring data, enabling cost attribution, user interaction troubleshooting, and conversation analytics for enterprise AI deployments.
Thanks all!
kyler